Learn a backend by following one request
Follow an image-export request through job, attempt and object identifiers while keeping sensitive payloads outside the logs.

Follow one request through a backend before trying to understand every module. For a developer learning an unfamiliar service, a small trace can connect the endpoint, background work and user-visible result. I prefer that route because it gives each file a purpose: it participates in an observed operation rather than merely appearing in a folder tree.
Use a hypothetical image-export service. The browser submits an export request, an API creates a job, a worker renders the image and storage holds the result. The first learning question is where time or failure can occur along that path, not which logging library has the longest feature list.
Define the operation you want to follow
Choose one fictional export and assign an identifier that can connect its events. The request identifier and job identifier may differ because one HTTP request creates work that outlives the connection. Preserve their relationship instead of forcing every stage into one misleading lifetime.
A small event record could contain the event name, timestamp, request identifier, job identifier, component and result category. Keep fields stable enough that you can compare two runs. Avoid placing an entire request body into the log just because it is convenient during development.
The OpenTelemetry observability primer explains logs, metrics and traces as different observability signals. A log records an event; a trace connects work across operations; a metric summarizes measurements. For this exercise, the important first step is to identify which signal can answer the question you are asking.
Read a small event sequence
Consider these invented events in their expected order. The identifiers are illustrative, and the table contains no measured latency results.
| Event | Identifiers | What it establishes |
|---|---|---|
| Request accepted | request R1, job J1 | The API accepted this operation under its contract |
| Job started | job J1, attempt A1 | A worker began an attempt |
| Render completed | job J1, attempt A1 | Rendering reached its completion point |
| Object stored | job J1, object O1 | The storage operation reported success |
| Job completed | job J1, object O1 | The job state references the stored result |
Each event should mean something precise. “Export successful” is ambiguous if it appears before storage completes. A worker can render successfully and still fail to publish a downloadable result. Name the event after the boundary it actually crossed.
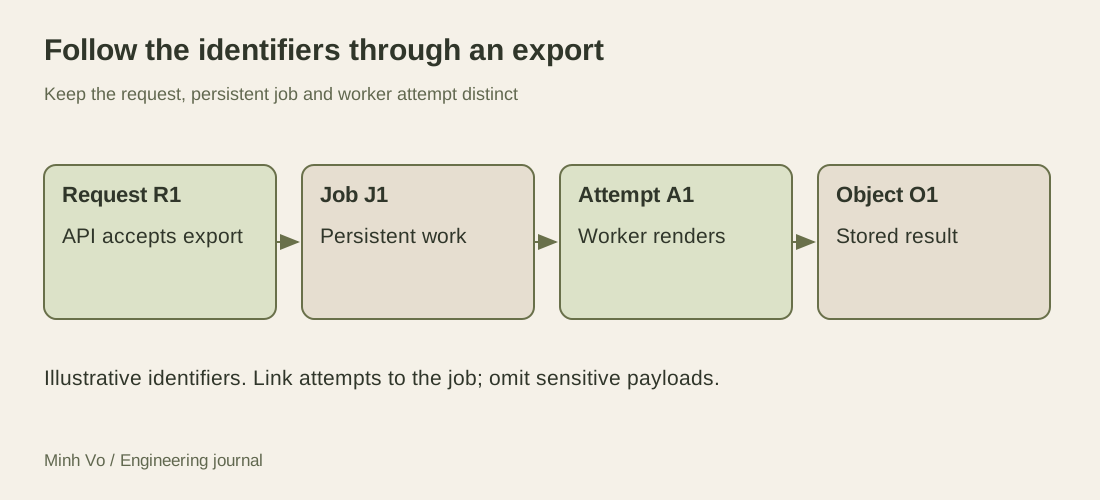
The diagram keeps the attempt separate from the job. A retry can create another attempt while the user still expects one export. Without that distinction, a log reader may interpret repeated worker activity as several separate user requests.
Use missing events carefully
Suppose the sequence stops after rendering. Storage might have failed, the process might have exited or the logging pipeline might have lost an event. The absence of a line is a clue, not proof of one explanation.
Choose the next check that separates those possibilities. Inspect whether the result object exists under the intended identifier. Check the job’s current state. Look for process termination or a storage error with the same job identifier. If the system has a trace, inspect the recorded operation boundaries and errors.
This creates a useful learning loop: state a hypothesis, identify the observation that would distinguish it and record the result. Reading more source can help, but it should answer a question from the trace. Otherwise, an unfamiliar repository can become an endless sequence of files with no growing model of behavior.
Keep sensitive content outside the event stream
An export request may contain document text, access tokens or signed download URLs. Those values can expose data or credentials when copied into logs. Use identifiers and bounded categories where they answer the operational question, and keep access to the logs appropriate to the information they contain.
The ACM Code of Ethics includes responsibilities to respect privacy and protect confidential information. In a learning notebook, use fictional identifiers and summarize the event rather than pasting a private production payload.
There is a tradeoff: removing too much context can make failures difficult to investigate. Decide which fields are necessary for a specific diagnostic task, how long they are retained and who may read them. An identifier that reveals a person’s identity indirectly still deserves care.
Finish with a request map
After following the export, draw the components it crossed and attach the evidence you found at each boundary. Note which part remains inferred. For example, the API may record that it queued a job while the queue’s actual delivery has not yet been inspected.
A useful final explanation says where the operation starts, what makes it complete and how you would investigate a missing result. It does not need to list every class in the repository. The next request you follow can differ in one meaningful way, such as a retry or a storage failure, so the map grows through evidence rather than through file count.
Distinguish request identity from trace context
Request R1, job J1 and attempt A1 answer application questions. A trace ID and span IDs describe how instrumented work is related. Keep those concepts separate: one job may be retried in another attempt, and a later status request can have its own HTTP request identity while still referring to the same job.
The OpenTelemetry context-propagation guide explains how a sending service passes trace and span context so a receiving service can connect its work to the caller. Instrumentation may do that automatically for a supported boundary. Across a background queue, verify the actual producer/consumer instrumentation and context carrier instead of assuming that moving the job identifier also propagates a trace.
For the export exercise, keep J1 in the application records so you can locate the work even when its trace was not retained. A trace relationship can add causal structure, but it does not replace the durable job record. Likewise, a shared trace ID is not an authorization credential. Context arriving from an untrusted caller needs the handling appropriate to the tracing system; the guide explicitly discusses forged incoming headers and unwanted outgoing context.
Investigate two attempts without merging them
Extend the fictional export. Attempt A1 finishes rendering, then exits before the application records a completed job. Attempt A2 begins later. It may discover an existing object, reuse it under the job’s policy or create another candidate result. A job ID alone cannot tell you which attempt produced which object.
| Evidence | Observation | Next question |
|---|---|---|
| A1 render event | Rendering finished | Was any object stored? |
| Object O1 exists | Storage contains that object | Which attempt created it, and is it referenced? |
| A2 started | Another worker attempt began | What recovery rule selected its work? |
| J1 references O2 | Current job result is O2 | Does O1 need cleanup under the retention policy? |
An object in storage does not prove a job completed. A completed job row does not prove a download still succeeds after expiry or deletion. Use the event sequence to choose the next state observation, then compare the result against the application’s contract.
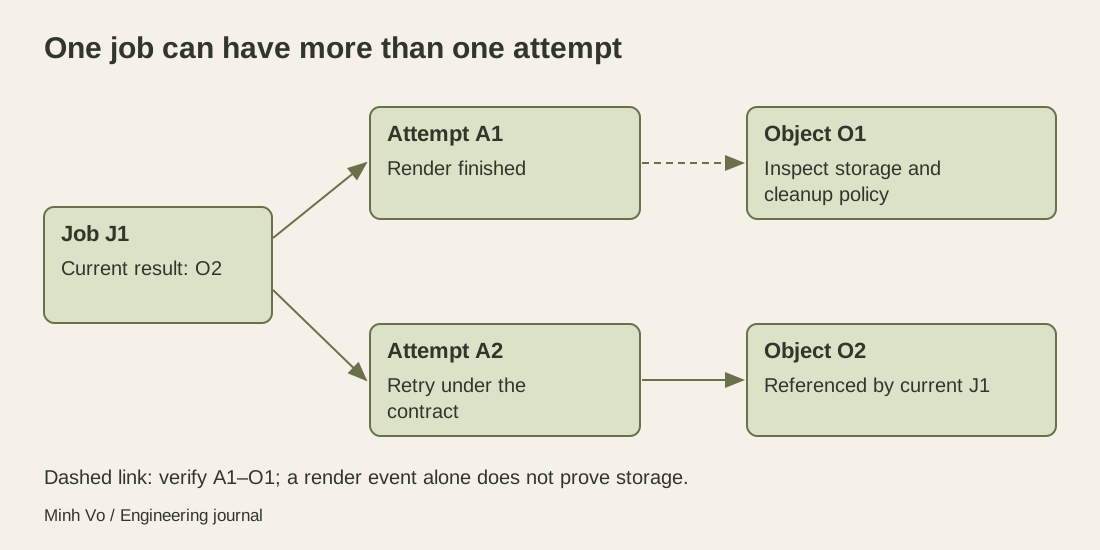
This also explains why repeated events need stable meaning. If an exporter resends the same recorded event after reconnecting, two collected lines might describe one occurrence. If two workers genuinely attempted the job, the attempt identifiers should differ. Add an event identity or sequence where the logging path needs deduplication; do not infer business duplication from line count alone.
Do not sort your way into a false timeline
Clock timestamps are useful, but different machines can disagree. Suppose an API event is labeled 10:00:00.100 and a worker event appears at 10:00:00.095. The worker’s clock might be behind. Sorting those two wall-clock values cannot establish that the worker ran before the request that created the job.
Preserve the causal identifiers and the component that produced each event. A collector’s receive time describes when telemetry arrived, which can differ from when the application event occurred. For elapsed time inside one process, use the runtime’s appropriate monotonic measurement rather than subtracting wall clocks that may be adjusted. Cross-service timing requires additional clock and instrumentation assumptions.
The OWASP logging guidance recommends time synchronization and recording uncertainty when time cannot be controlled. For a learning report, say which timestamps you compared and which conclusion they support. The original five-event table shows expected logical order; it supplies no duration measurement.
Choose an event schema you can inspect safely
Start with explicit allowed fields: event name, component, request/job/attempt identifiers and a bounded result category. Add object identity only when it helps locate the relevant stored result and the log audience may see it. Treat a user-controlled title, query string or exception message as untrusted input, even when it appears inside a structured event.
OWASP’s logging guidance covers both sensitive data exclusion and log injection through control characters or delimiters. Structured serialization helps preserve a message as one field, but does not make its contents appropriate to store or safe for every downstream viewer. Avoid copying access tokens or signed download URLs into the event schema; decide how to represent an error without reproducing the entire request.
Run three diagnostic exercises: interrupt storage after render, temporarily stop the telemetry collector, and let a retry create a second attempt under the stated job contract. Compare the application’s durable state with the events that arrive. This is a proposed local exercise; a collector outage should not be reported as tested until you actually observe its buffering and failure behavior.
The learning result is a map you can use when evidence is incomplete. For each missing result, identify the job state, the attempt history and the storage object separately. Then explain which observation would change your current hypothesis. That gives the next source file you open a concrete question to answer.