Publish metrics with explicit units and denominators
Calculate a combined request-quality SLI in SQLite, distinguish conditional denominators and fast errors, and bound the result when duration measurements are missing.
A request-quality percentage is incomplete without the events being counted and the rule that makes an event good. A fast error can improve a latency-only chart while a customer receives no useful result. Excluding that error from the denominator can make the remaining successes look healthy, but answers a narrower question.
This article is for a data engineer publishing an operational metric from request records. It assumes basic SQL and uses a small synthetic dataset executed with SQLite. The task is to publish a reproducible fraction, explain its units and distinguish a bad outcome from an outcome that cannot yet be classified. The example implements neither a telemetry exporter nor a production alert.
State the population before calculating the percentage
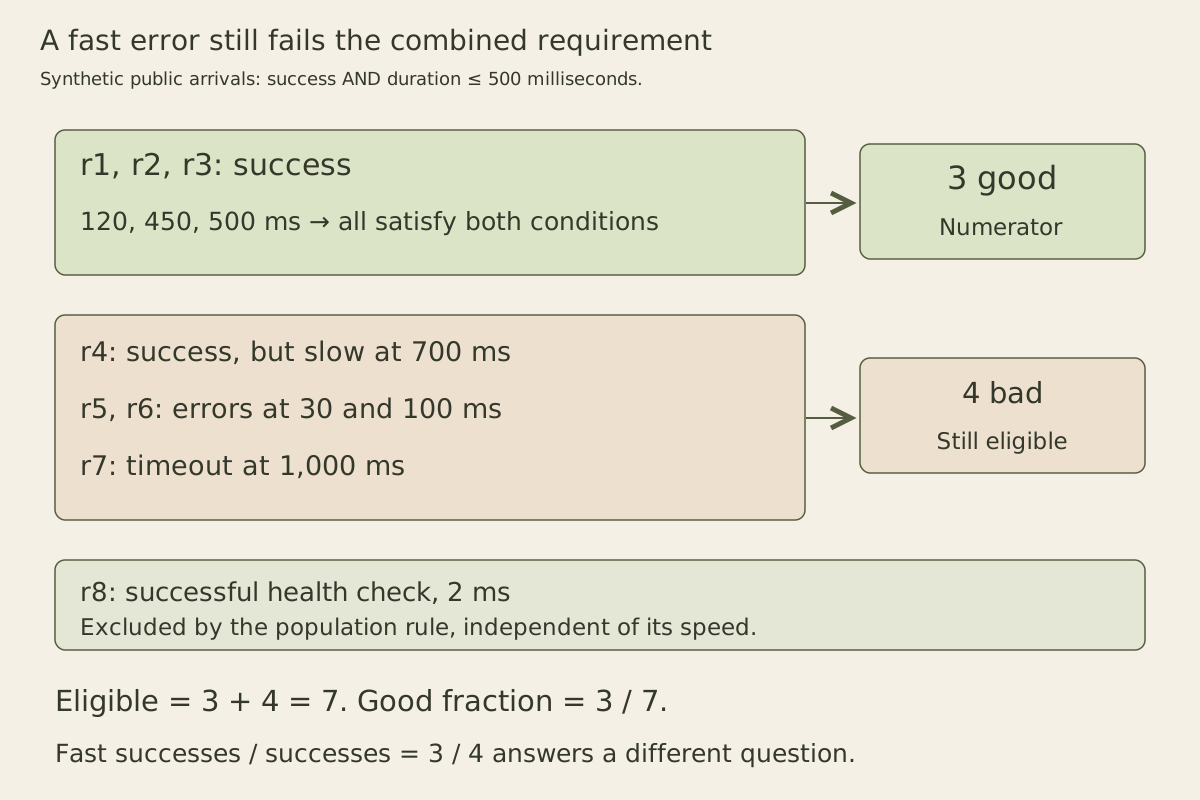
Our intended population is public requests arriving at the service boundary during October 2, 2026, in UTC. Health checks are excluded by an explicit policy. Each request is one observation, including unsuccessful requests; retries would be separate requests. A good observation must both succeed and finish within 500 milliseconds, including exactly 500.
Google’s SRE Workbook describes SLIs as good events divided by total events and distinguishes the desired service outcome from its measurement implementation. Here, 500 milliseconds is an invented acceptance threshold for that outcome. It is not a recommended latency target. Nor is it the SLO itself: an SLO would separately specify a desired proportion and evaluation window.
The fixture assumes unique request IDs, canonical UTC timestamps, validated request kinds and terminal outcomes, and nonnegative integer milliseconds or NULL. It also assumes the arrival population has been captured completely. These are upstream preconditions, not guarantees supplied by SQLite’s column declarations. Requests that never reach this measurement boundary require a different measurement if they belong in the user-facing objective.
Keep successful, unsuccessful and unclassified requests visible
Run the SQL blocks in order in one fresh database. All eight baseline requests have terminal outcomes. The final health check is present in the raw table but excluded from the eligible population.
CREATE TABLE requests (
  request_id TEXT PRIMARY KEY,
  arrived_at TEXT,
  kind TEXT,
  outcome TEXT,
  latency_ms INTEGER
);
INSERT INTO requests VALUES
 ('r1','2026-10-02T00:00:00Z','public','success',120),
 ('r2','2026-10-02T08:00:00Z','public','success',450),
 ('r3','2026-10-02T09:00:00Z','public','success',500),
 ('r4','2026-10-02T10:00:00Z','public','success',700),
 ('r5','2026-10-02T11:00:00Z','public','error',30),
 ('r6','2026-10-02T12:00:00Z','public','error',100),
 ('r7','2026-10-02T13:00:00Z','public','timeout',1000),
 ('r8','2026-10-02T14:00:00Z','health','success',2);

CREATE VIEW eligible AS
SELECT * FROM requests
WHERE kind = 'public'
  AND arrived_at >= '2026-10-02T00:00:00Z'
  AND arrived_at <  '2026-10-03T00:00:00Z';

CREATE VIEW classified AS
SELECT *, CASE
  WHEN outcome IN ('error','timeout') THEN 'bad'
  WHEN latency_ms IS NULL THEN 'unknown'
  WHEN latency_ms <= 500 THEN 'good'
  ELSE 'bad'
END AS quality
FROM eligible;

CREATE VIEW quality_counts AS
SELECT COUNT(*) AS eligible_count,
       COALESCE(SUM(quality = 'good'),0) AS good_count,
       COALESCE(SUM(quality = 'bad'),0) AS bad_count,
       COALESCE(SUM(quality = 'unknown'),0) AS unknown_count
FROM classified;
Ordering the conditions matters. An error already fails the combined success-and-latency requirement, even when its duration is missing. A successful request with missing duration remains unknown. SQLite’s CASE documentation specifies that the first true WHEN selects the result. An unexpected outcome string could be misclassified here, which is why validating the allowed outcome set before this query is part of the contract.
Publish the counts alongside the fraction. The query withholds a point value when classification is incomplete and leaves an empty population undefined. Its lower and upper values describe possible classifications of observed unknown requests.
SELECT eligible_count, good_count, bad_count, unknown_count,
       CASE WHEN eligible_count > 0 AND unknown_count = 0
            THEN 1.0 * good_count / eligible_count END AS good_fraction,
       CASE WHEN eligible_count > 0
            THEN 1.0 * good_count / eligible_count END AS lower_fraction,
       CASE WHEN eligible_count > 0
            THEN 1.0 * (good_count + unknown_count) / eligible_count
       END AS upper_fraction
FROM quality_counts;
The baseline counts are 7 eligible, 3 good, 4 bad and 0 unknown. All three fractions equal 3/7, approximately 0.428571. The SQL uses floating-point division; the small integer counts preserve the exact mathematical ratio for another consumer. Formatting the value as 42.86% is a display decision, not a different measurement.
The result is also distinct from throughput. Duplicating the baseline requests with new IDs doubles both counts and preserves 3/7; it does not imply the same load. Retain request volume alongside quality when deciding whether capacity needs attention.
Compare different denominators openly
Two tempting alternatives produce larger values on exactly the same baseline data:
SELECT
  SUM(outcome = 'success' AND latency_ms <= 500) AS good_count,
  COUNT(*) AS all_requests,
  SUM(outcome = 'success') AS successful_requests,
  SUM(latency_ms <= 500) AS fast_requests
FROM eligible;
This returns 3, 7, 4 and 5. Dividing the good count by successful requests yields 3/4, or 75%: the proportion of successes that were fast enough. Dividing fast requests by all requests yields 5/7: the proportion that finished quickly, including the two fast errors. Either could be useful for a separately named diagnostic. Neither is the agreed combined request-quality fraction.
Retain the numerator’s definition when naming a dashboard. “Fast successful requests among all public arrivals” makes both conditions visible. “Performance” hides them. If a consumer wants a different population, publish a separate definition rather than silently changing the existing denominator.
Missing duration creates a bounded answer
Now add one successful request whose duration was lost. Its arrival is known, so removing it would selectively shrink the denominator.
INSERT INTO requests VALUES
 ('r9','2026-10-02T15:00:00Z','public','success',NULL);
SELECT eligible_count, good_count, bad_count, unknown_count,
       CASE WHEN eligible_count > 0 AND unknown_count = 0
            THEN 1.0 * good_count / eligible_count END AS good_fraction,
       CASE WHEN eligible_count > 0
            THEN 1.0 * good_count / eligible_count END AS lower_fraction,
       CASE WHEN eligible_count > 0
            THEN 1.0 * (good_count + unknown_count) / eligible_count
       END AS upper_fraction
FROM quality_counts;
The counts become 8, 3, 4 and 1. The point value is NULL; the bounds are 3/8 and 4/8. If the lost duration is at most 500 milliseconds, the request is good; otherwise it is bad. These are attainable classification bounds, not a confidence interval and not protection against missing arrivals or dishonest units. A policy may deliberately count unknowns as failures, but that produces a conservative policy score that should be named explicitly.
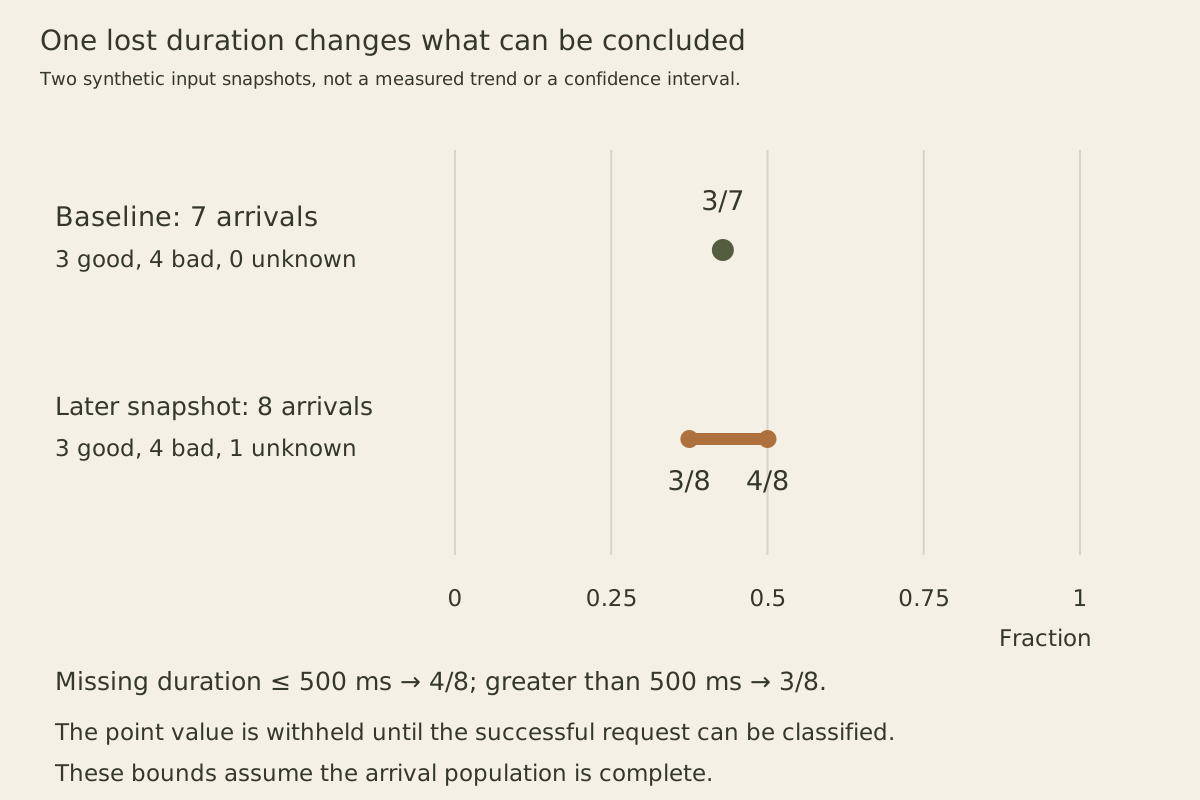
A missing duration on an error is still a telemetry defect even though this combined outcome is known to be bad. Track measurement completeness separately; an unknown-quality count alone does not count every missing measurement.
Publish units and knowledge boundaries
Store this fraction as a dimensionless value between zero and one. Prometheus naming guidance recommends ratios rather than percentages from 0 to 100 and seconds for duration metrics. The fixture’s explicit millisecond field is acceptable internally, but exporting durations in seconds requires dividing values by 1,000 and converting the boundary to 0.5 seconds together. Renaming a field performs no conversion.
Follow the destination’s naming convention. Prometheus recommends unit suffixes; OpenTelemetry’s metric conventions generally omit units from names when metadata already carries them and recommend seconds for durations. These are different naming conventions, not different physical quantities.
A published result should retain its definition version, UTC arrival window, 500-millisecond inclusive threshold, eligible/good/bad/unknown counts and input snapshot identifier. Source coverage also needs independent evidence: a query over delivered rows cannot prove that a collector lost none. Waiting for terminal outcomes may change when a report can be finalized; it should not silently move arrivals into their completion day. Late evidence requires a documented revision or a separately identified snapshot.
Exercise the boundaries
Recreate the baseline before each independent exercise. Change r3 from 500 to 501 milliseconds: good requests fall from three to two. Set r5’s duration to NULL: it remains bad, while the missing-duration count increases. Move r1 to exactly the next day’s midnight: it leaves the population. Remove every public request: all counts are zero and every fraction is NULL, even though a health check remains.
Finally, repeat the ninth-request example and restore its duration first to 500 and then to 501 on that same modified database. The fractions reach 4/8 and 3/8, respectively. Those two cases explain what the interval means. None establishes a production reliability target or proves that the arrival feed is complete.