Understand Parquet row groups through an actual small scan
Write the same twelve trips in two orders, inspect actual date statistics, and distinguish column projection, candidate row groups and measured query results.
A Parquet query can ignore most of a table without first loading every row into a dataframe. Two separate decisions make that possible: which columns the query needs, and which groups of rows might contain a match. Confusing those decisions makes it easy to mistake a small result for a small scan.
This walkthrough is for someone comfortable with a filtered SQL aggregate. We will write twelve synthetic trips, inspect their actual metadata, and execute the same calculation over two physical orderings. The local environment is Python 3.12.3, PyArrow 23.0.1 and DuckDB 1.4.4. The experiment measures returned rows and a deliberately implemented scan, not storage latency or operating-system read bytes.
A row group contains columns for the same rows
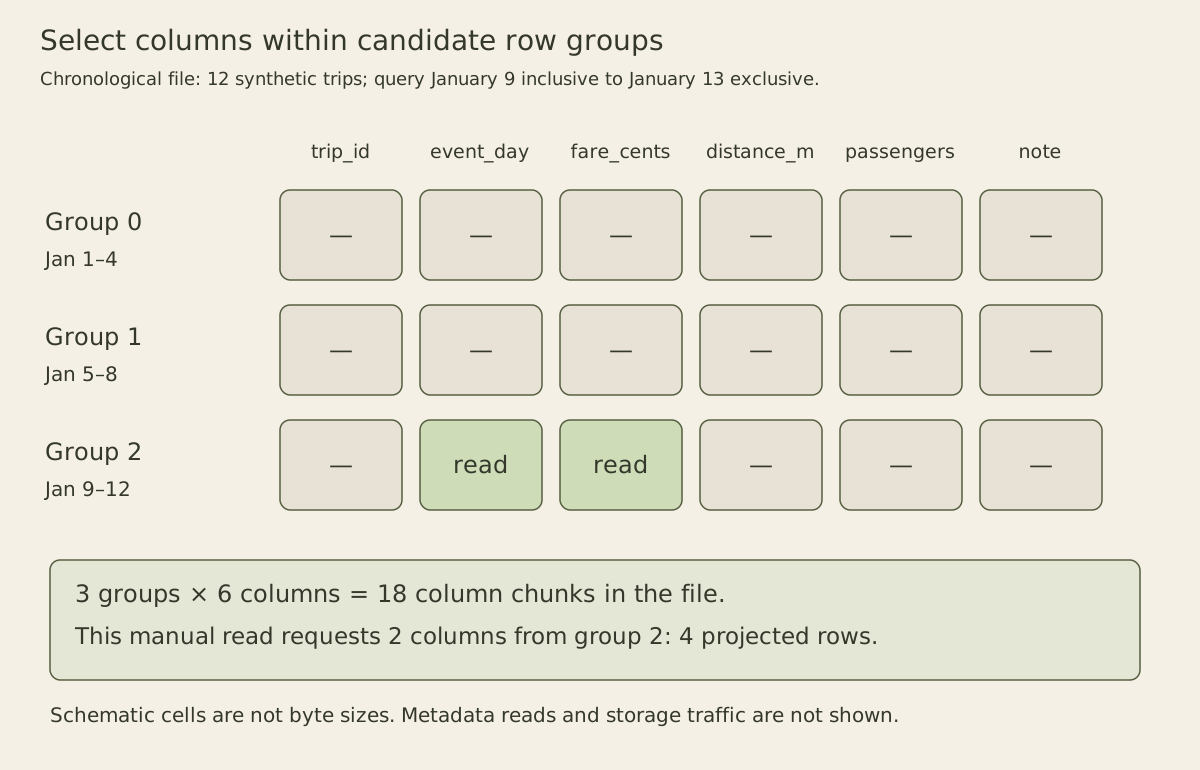
A row group is a logical horizontal slice of a table. Inside it, each column has a column chunk; chunks contain encoded pages. In this flat six-column example, every group has six chunks. A chunk for fare_cents describes the same four trips as its neighboring event_day chunk, even though the values are stored separately. The Parquet terminology reference distinguishes these levels and guarantees contiguous storage for a column chunk, not a particular physical structure for a whole row group.
The file-format description places file metadata after the data and records chunk locations. A reader normally obtains that metadata before deciding which chunks matter. Thus “skip a row group” does not mean “read nothing from the file.” Metadata itself has a cost.
Our query counts trips and sums fares from January 9 inclusive through January 13 exclusive. It needs event_day for the predicate and fare_cents for the sum. It does not need the receipt note, passenger count, distance or trip identifier. The result has two fields, but those output fields are not a literal list of source columns: count(*) is an aggregate, and the date column remains necessary despite not appearing in the output.
Write the same logical table in two orders
All twelve rows are fabricated, with one trip per day in January 2026. Trip i has a fare of 100*i cents. The date is already a trusted reporting date; this fixture does not infer it from a local timestamp. Cents are exact integers, and all sums fit the chosen representation.
The first file preserves chronological order. The second permutes exactly the same rows. Both use four rows per group, explicit statistics, and no dictionary encoding or compression. Those settings make the example inspectable; they are not recommended production defaults. Arrow’s versioned writer documentation defines row_group_size as a maximum row count, not a byte size.
from datetime import date
from pathlib import Path
from tempfile import TemporaryDirectory
import pyarrow as pa
import pyarrow.compute as pc
import pyarrow.parquet as pq
import duckdb

schema = pa.schema([
    ('trip_id', pa.int64()), ('event_day', pa.date32()),
    ('fare_cents', pa.int64()), ('distance_m', pa.int32()),
    ('passengers', pa.int16()), ('note', pa.string()),
])
rows = [dict(trip_id=i, event_day=date(2026, 1, i),
             fare_cents=100*i, distance_m=500*i,
             passengers=1+i%3, note='Synthetic receipt ' + str(i))
        for i in range(1, 13)]
original = pa.Table.from_pylist(rows, schema=schema)
scrambled = original.take(pa.array([0, 4, 8, 1, 5, 9, 2, 6, 10, 3, 7, 11]))
work = TemporaryDirectory()
root = Path(work.name)
for name, table in [('sorted', original), ('scrambled', scrambled)]:
    pq.write_table(table, root / f'{name}.parquet', row_group_size=4,
                   compression='NONE', use_dictionary=False,
                   write_statistics=True)

def describe(path):
    metadata = pq.ParquetFile(path).metadata
    day_column = schema.get_field_index('event_day')
    return [(g, metadata.row_group(g).num_rows,
             metadata.row_group(g).column(day_column).statistics.min,
             metadata.row_group(g).column(day_column).statistics.max)
            for g in range(metadata.num_row_groups)]

for name in ('sorted', 'scrambled'):
    print(name, describe(root / f'{name}.parquet'))
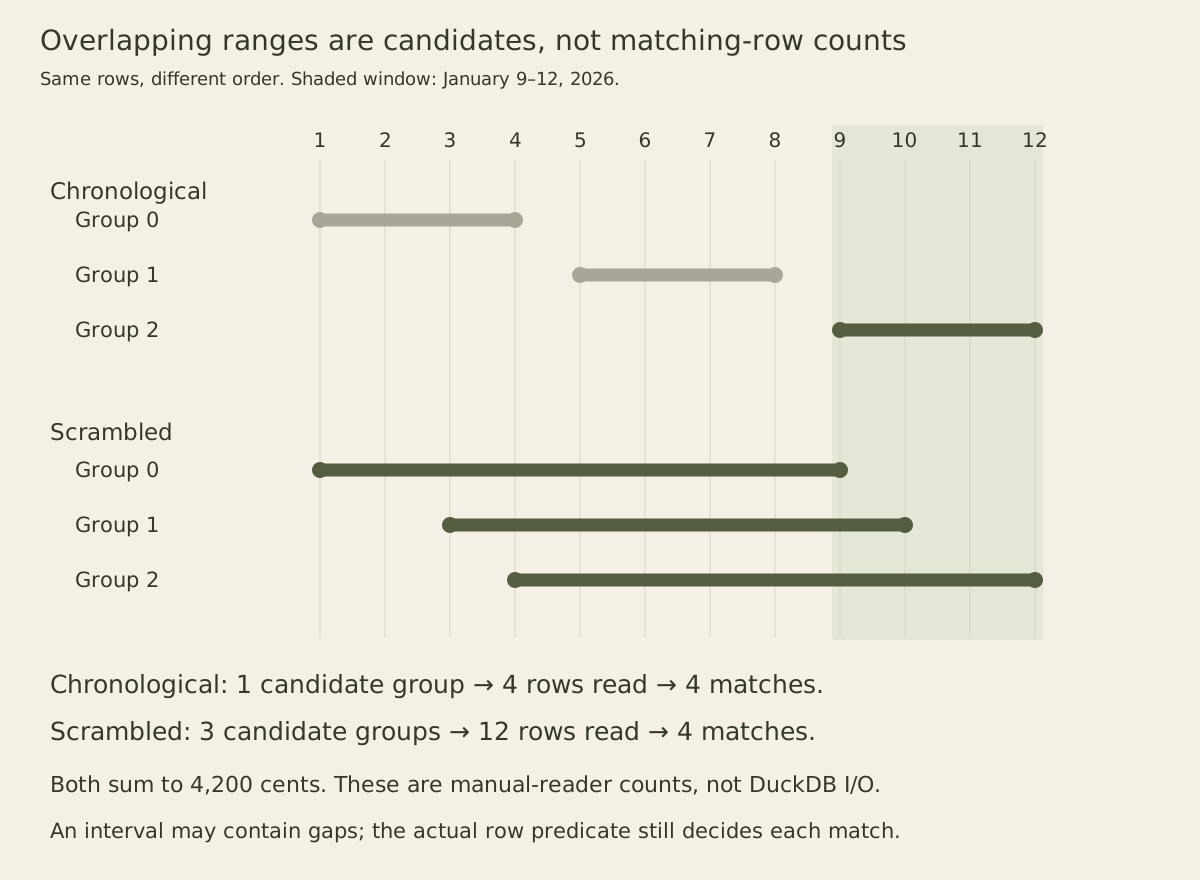
Run the subsequent blocks in the same Python process so they share the temporary directory. Each file has twelve rows and three groups. The inspected day ranges are:
| Group | Chronological file | Scrambled file |
|---|---|---|
| 0 | January 1–4 | January 1–9 |
| 1 | January 5–8 | January 3–10 |
| 2 | January 9–12 | January 4–12 |
These ranges are summaries, not lists of every day present. The scrambled group 0 contains days 1, 5, 9 and 2. Its minimum and maximum do not establish that days 3, 4, 6, 7 or 8 occur there.
Eliminate impossible groups, then test actual rows
For a half-open date interval [lower, upper), a group cannot contribute when its maximum is below lower, or its minimum is at least upper. Otherwise the range overlaps and the group remains a candidate. Overlap is permission to inspect it, not proof that any row matches.
The next helper is deliberately limited to this flat date32 column and ordinary date-range comparison. It trusts correctly written metadata. Missing statistics are treated conservatively by retaining the group. It is not a general Parquet optimizer for nested columns, arbitrary expressions, invalid metadata or different comparison semantics.
def possible_groups(path, lower, upper):
    parquet = pq.ParquetFile(path)
    day_column = parquet.schema_arrow.get_field_index('event_day')
    selected = []
    for g in range(parquet.metadata.num_row_groups):
        stats = parquet.metadata.row_group(g).column(day_column).statistics
        if stats is None or not stats.has_min_max:
            selected.append(g)
        elif not (stats.max < lower or stats.min >= upper):
            selected.append(g)
    return selected


def manual_summary(path, lower, upper):
    groups = possible_groups(path, lower, upper)
    table = pq.ParquetFile(path).read_row_groups(
        groups, columns=['event_day', 'fare_cents'])
    mask = pc.and_(pc.greater_equal(table['event_day'], pa.scalar(lower)),
                   pc.less(table['event_day'], pa.scalar(upper)))
    matches = table.filter(mask)
    return groups, table.num_rows, matches.num_rows, pc.sum(matches['fare_cents']).as_py()

for name in ('sorted', 'scrambled'):
    print(name, manual_summary(root / f'{name}.parquet',
                               date(2026, 1, 9), date(2026, 1, 13)))
The exact outputs are sorted ([2], 4, 4, 4200) and scrambled ([0, 1, 2], 12, 4, 4200). Each tuple reports candidate group indices, rows materialized by this manual reader, matching rows and summed cents. Both answers are four trips and 4,200 cents: 900 + 1,000 + 1,100 + 1,200.
Chronological order allows the metadata test to eliminate groups 0 and 1. Scrambled order spreads later dates across all three ranges, so this reader materializes twelve projected rows before filtering them. The manual reader asks Arrow for both selected columns in each retained group; it does not rely on an undocumented assumption that Arrow independently implements the same pruning rule.
Change the interval to January 6 inclusive through January 7 exclusive. Every scrambled range still overlaps, yet only one actual trip matches. This is a useful counterexample to treating a min/max overlap as a row count. Date ordering creates an opportunity to skip groups, while the row predicate establishes the answer.
Execute the SQL without claiming an unmeasured scan
DuckDB’s Parquet documentation describes projection pushdown and filter pushdown. The former limits requested columns; the latter can use available statistics to avoid irrelevant regions. The following query actually runs against both files:
with duckdb.connect() as connection:
    for name in ('sorted', 'scrambled'):
        answer = connection.execute('''
            SELECT count(*), sum(fare_cents)
            FROM read_parquet(?)
            WHERE event_day >= DATE '2026-01-09'
              AND event_day < DATE '2026-01-13'
        ''', [str(root / f'{name}.parquet')]).fetchone()
        print(name, answer)
        assert answer == (4, 4200)
It returns (4, 4200) twice. That proves agreement on this fixture. It does not prove that DuckDB issued exactly the same reads as our manual Arrow implementation. A reader may use additional metadata, buffering, parallel tasks or other optimizations. To report storage traffic or elapsed-time improvements, instrument that execution and state its filesystem, cache state, versions and workload.
Hannes Mühleisen and Mark Raasveldt’s June 25, 2021 technical article explains projection and date-range skipping with a taxi dataset. We use that mechanism here, not its historical timings or comparisons with other dataframe readers. Twelve rows are enough to inspect correctness; they cannot establish a useful production speed ratio.
Remove statistics and inspect the fallback
Metadata availability is part of the experiment. Rewrite the chronological table with statistics disabled, then rerun the manual scan. Also ask the original file for an interval entirely beyond its dates:
without_stats = root / 'without-stats.parquet'
pq.write_table(original, without_stats, row_group_size=4,
               compression='NONE', use_dictionary=False, write_statistics=False)
print('no stats', manual_summary(without_stats, date(2026, 1, 9), date(2026, 1, 13)))
print('outside', manual_summary(root / 'sorted.parquet', date(2026, 1, 20), date(2026, 1, 21)))
The first result is ([0, 1, 2], 12, 4, 4200): the answer is unchanged, but no group can be eliminated by this helper. The outside interval gives ([], 0, 0, None). There are no matching fares, so the sum is null rather than an observed zero-valued total. SQL SUM uses the same empty-input distinction in this example.
Treat these as checks of explicit assumptions. An all-null date group also has no useful min/max pair; retaining it is safe, and the later date predicate removes its null dates. Do not invent a minimum of zero or assume absent statistics mean no matching rows. Ingestion validation, source completeness and correct units remain separate responsibilities from file pruning.
Choose boundaries for a workload
Four-row groups are educational. Smaller groups can describe narrower ranges and offer more independent work, but they also add metadata and processing overhead. Larger groups reduce the number of boundaries while potentially forcing more irrelevant rows through a scan. Sorting has its own write cost and helps only filters related to the chosen order. A file ordered by day does not automatically provide narrow ranges for every passenger count or fare.
Keep these choices distinct from directory partitioning and file count. Splitting data into thousands of tiny files changes listing, opening and metadata costs; it is not equivalent to changing the row-group size inside one file. Column projection is also an efficiency decision, not an access-control boundary: a caller permitted to read the whole file may request the other columns.
For a final exercise, rewrite the chronological table with six rows per group. Predict which groups overlap January 9 through January 12, then inspect and run the manual reader. It should retain one group containing six rows, return four matches and preserve 4,200 cents. Next query January 8 inclusive through January 10 exclusive against the original four-row grouping: two groups are candidates, eight rows are materialized, and two fares sum to 1,700 cents. Recreate the fixture before repeating changes, and call work.cleanup() when finished. The useful result is an explanation of what could be skipped and why, grounded in metadata and matching rows.