Why averaging group averages changes the answer
Class sizes of two and eight produce different weighted and unweighted exam averages. A worked analytical example with explicit assumptions and checked results.
To average group averages across individual observations, weight each group mean by the number of observations that contributed to it. Averaging the means without those weights gives every group equal influence. That can be the intended question, but it is not the same as the mean across all people or records.
Suppose you are combining class exam reports. A class of two students has a mean of 90, while a class of eight has a mean of 60. The average class mean is 75. The average student score is 66 because the larger class contributes four times as many students.
Reconstruct the underlying totals
Here is a complete synthetic dataset for the two classes:
CREATE TEMP TABLE scores (class_id TEXT, score INTEGER);
INSERT INTO scores VALUES
  ('A', 80), ('A', 100),
  ('B', 40), ('B', 50), ('B', 50), ('B', 60),
  ('B', 60), ('B', 70), ('B', 70), ('B', 80);

WITH classes AS (
  SELECT class_id, COUNT(score) AS students, AVG(score) AS mean_score
  FROM scores
  GROUP BY class_id
)
SELECT AVG(mean_score) AS equal_class_mean,
       SUM(students * mean_score) / SUM(students) AS pooled_mean
FROM classes;

SELECT AVG(score) AS direct_mean FROM scores;
SQLite 3.45.1 returns 75 for the equal-class mean, 66 for the pooled mean, and 66 for the direct mean. The weighted expression reconstructs each class’s score total before dividing by the total number of scored students.
The arithmetic is small enough to audit directly. Class A contributes 180 points and class B contributes 480. Their combined 660 points divided among ten students gives 66. Adding 90 and 60 and dividing by two answers how the average class performed when each class receives equal weight.
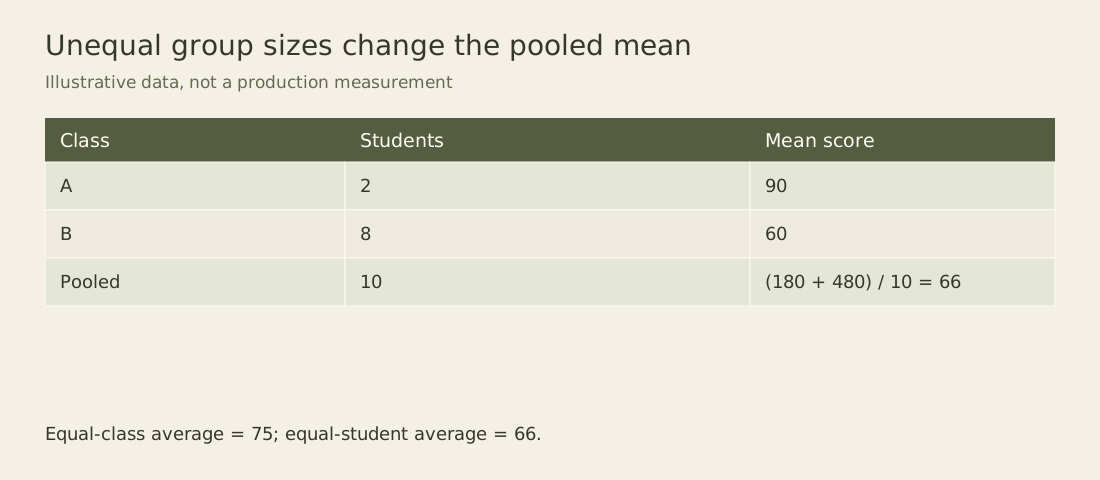
The figure keeps group sizes next to the means because a mean without its denominator cannot generally be pooled. Two reports may show identical means yet represent very different amounts of observed data.
Preserve sufficient information in aggregate tables
An analytical table storing only a rounded mean loses information needed for precise recombination. Store the contributing sum and count where the metric permits it. Downstream queries can then calculate the pooled mean by summing those components.
For example, a mean rounded to one decimal place may no longer reproduce the original total after multiplication by the group count. Repeatedly combining rounded means can accumulate discrepancies. Keep full precision in stored measures and apply display rounding at the presentation boundary.
The PostgreSQL aggregate documentation states that the ordinary average uses non-null input values. Therefore the matching count is the count of non-null scores. Counting all enrolled students, including those without a score, changes the denominator and no longer reconstructs the mean of observed scores.
If class A also has an ungraded student represented by null, its observed mean still uses two scores. Weighting that mean by three would invent a contribution from the missing score. A report about enrolled students may need a missing-score policy, but that policy must be stated separately from the aggregation arithmetic.
Equal group weights can be a deliberate choice
Observation-count weights in this example are nonnegative integers. If a separate survey supplies fractional expansion weights, those weights describe a sampling design rather than class size. The weighted formula still has an arithmetic meaning, but its population interpretation depends on that design. Do not mix survey weights and raw observation counts in one column merely because both are called weights. Preserve the weight definition with the metric.
There are reasons to give each group one vote. A district may want a summary of its typical classroom rather than its typical student. A service comparison may want to treat each customer organization equally so one large organization does not dominate the result.
Those are changes to the unit being averaged. They should appear in the measure name and description. “Average of classroom means” is a clearer label than “average score” when group weights are equal. A useful dashboard may show both measures because they reveal different aspects of the population.
Be careful when group membership changes over time. A rise in the overall student mean can occur because more students moved into a higher-scoring class, even if neither class improved. Comparing group means and group sizes helps separate composition changes from within-group changes. The arithmetic alone does not establish the cause of either change.
Ratios need their own underlying quantities
The same principle applies to rates, but the weights must match the rate’s denominator. To combine conversion rates, sum conversions and eligible visits before dividing. To combine average order values, sum revenue and eligible orders. A customer count is the wrong weight for a rate defined per visit unless each customer contributes exactly one visit.
Some metrics cannot be combined using only a mean and count. A median of daily medians is generally not the median of all observations. Quantiles require more information about the distribution, exact retained values, or a mergeable approximation with a stated error model. Do not generalize the weighted-mean identity to every summary statistic.
Even arithmetic means can require a domain check. Combining scores from exams with different scales is invalid until the scores have a justified common interpretation. A percentage correct on a short easy test and a percentage correct on a difficult test are not automatically interchangeable observations.
Before using an aggregate table, inspect the denominator, missing-value rule, grouping identity, and stored precision. Then reproduce its pooled result from a small raw-data fixture. For the example above, a query that cannot recover 66 has either changed the unit of analysis or lost one of the components needed to preserve it.
A higher pooled mean can accompany declines in every group
To separate composition from within-group performance, extend the example to two weekly extracts. These are synthetic summaries of observed scores, with disjoint student records inside each week. Week one repeats the original class sizes and totals. In week two, class A has eight observed scores averaging 85 and class B has two averaging 55. Both class means fell by five, while more observations now belong to the higher-scoring class.
CREATE TEMP TABLE weekly_scores (
  week INTEGER, class_id TEXT,
  score_sum INTEGER, scored_students INTEGER,
  PRIMARY KEY (week, class_id)
);
INSERT INTO weekly_scores VALUES
  (1, 'A', 180, 2), (1, 'B', 480, 8),
  (2, 'A', 680, 8), (2, 'B', 110, 2);

SELECT week, SUM(score_sum) * 1.0 / SUM(scored_students) AS pooled_mean
FROM weekly_scores GROUP BY week ORDER BY week;

WITH base_weights AS (
  SELECT class_id, scored_students AS base_count
  FROM weekly_scores WHERE week = 1
)
SELECT w.week,
  SUM((w.score_sum * 1.0 / w.scored_students) * b.base_count)
    / SUM(b.base_count) AS fixed_composition_mean
FROM weekly_scores AS w JOIN base_weights AS b USING (class_id)
GROUP BY w.week ORDER BY w.week;
The pooled mean rises from 66 to 79. The fixed-composition result falls from 66 to 61 because it holds A’s weight at two and B’s at eight in both weeks. Its second calculation is (85 × 2 + 55 × 8) / 10. This is a constructed reversal caused by changing group proportions. It does not show that individual students improved, declined, or switched classes; these aggregate rows do not identify students across weeks.
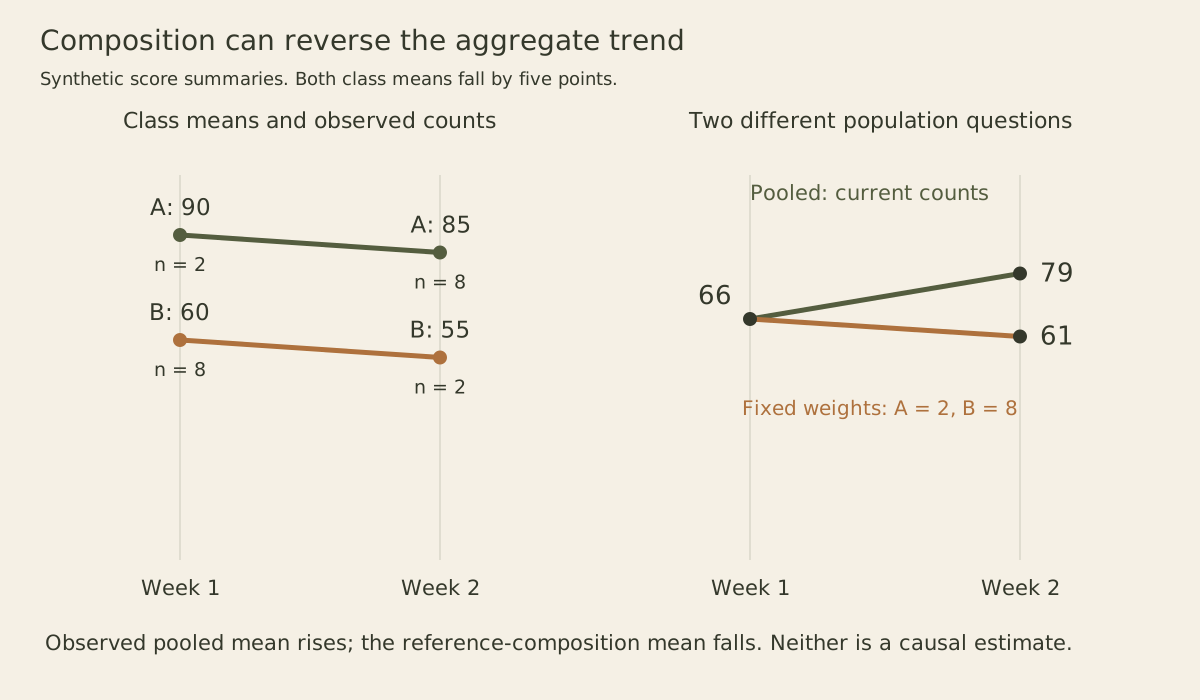
The two series answer different questions. The pooled series describes the observed students each week. The standardized series describes what the class means would produce under the chosen reference composition. Calling the second series “adjusted” does not make it a causal estimate. It controls only the weighting difference encoded in these two class labels and retains any differences within each class.
The query assumes every reference class has a positive observed count in every compared week. If a class is absent, the inner join silently drops its reference weight. A production report should first compare expected class identities with available summaries and report incomplete coverage. Do not normalize the remaining weights and retain the old label unless the new target population is intentional. A zero observed count also leaves that class mean undefined; treating it as zero would invent scores.
For an exercise, rebuild this fixture, change week two’s counts to A equals two and B equals eight, and change the totals to 170 and 440. Both the pooled and fixed-composition week-two means become 61. Then restore the original fixture and delete class B’s week-two row. The displayed query returns 85 for that week, a deliberately misleading partial result if it is presented as the same two-class standardized measure. The right response is a coverage failure or an explicitly narrower label, not a guessed score for the missing class.
When an aggregate trend surprises you, retain the raw pooled result, show group counts and means, and state any reference weights used for comparison. That preserves the observed population while making a composition-sensitive interpretation inspectable. It also gives the next analyst enough information to reproduce the numbers without trusting a rounded dashboard label.